
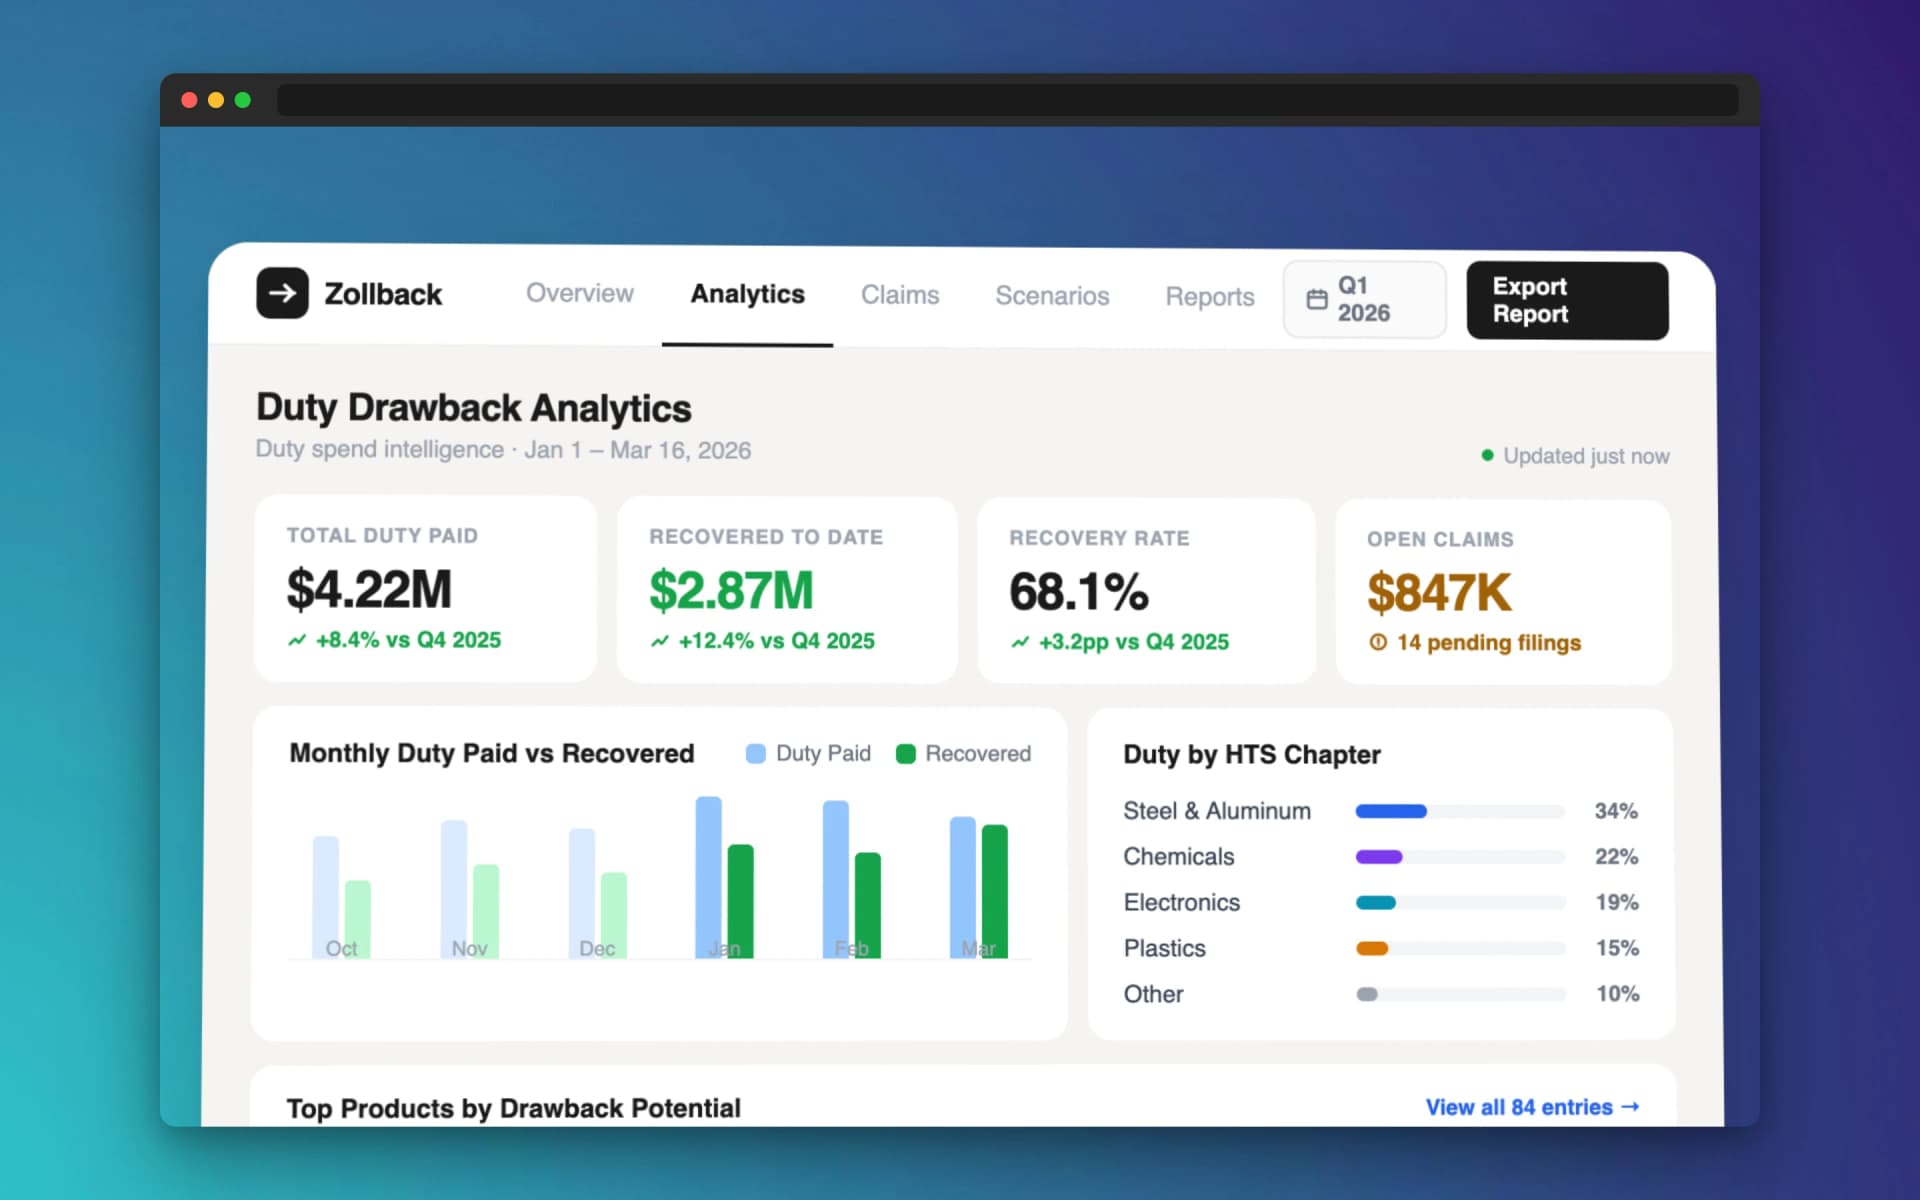
Duty Drawback Analytics for Strategic Decisions
Zollback's analytics engine transforms your raw trade data into duty spend intelligence — helping CFOs and supply chain leaders optimize sourcing and maximize recovery.
Turn Duty Spend Data Into Sourcing Strategy
Traditional drawback providers deliver a check and a summary. Zollback's duty drawback analytics engine goes further — producing data-driven reports on duty spend across products, suppliers, HTS codes, and trade lanes. Because Zollback's AI structures every document it ingests, your trade data becomes a queryable, analyzable asset. CFOs and supply chain VPs can finally answer questions that manual providers cannot: which product lines generate the most recoverable duties, which suppliers drive the most drawback-eligible transactions, and how tariff shifts affect your recovery potential.
Turn Duty Spend Data Into Sourcing Strategy
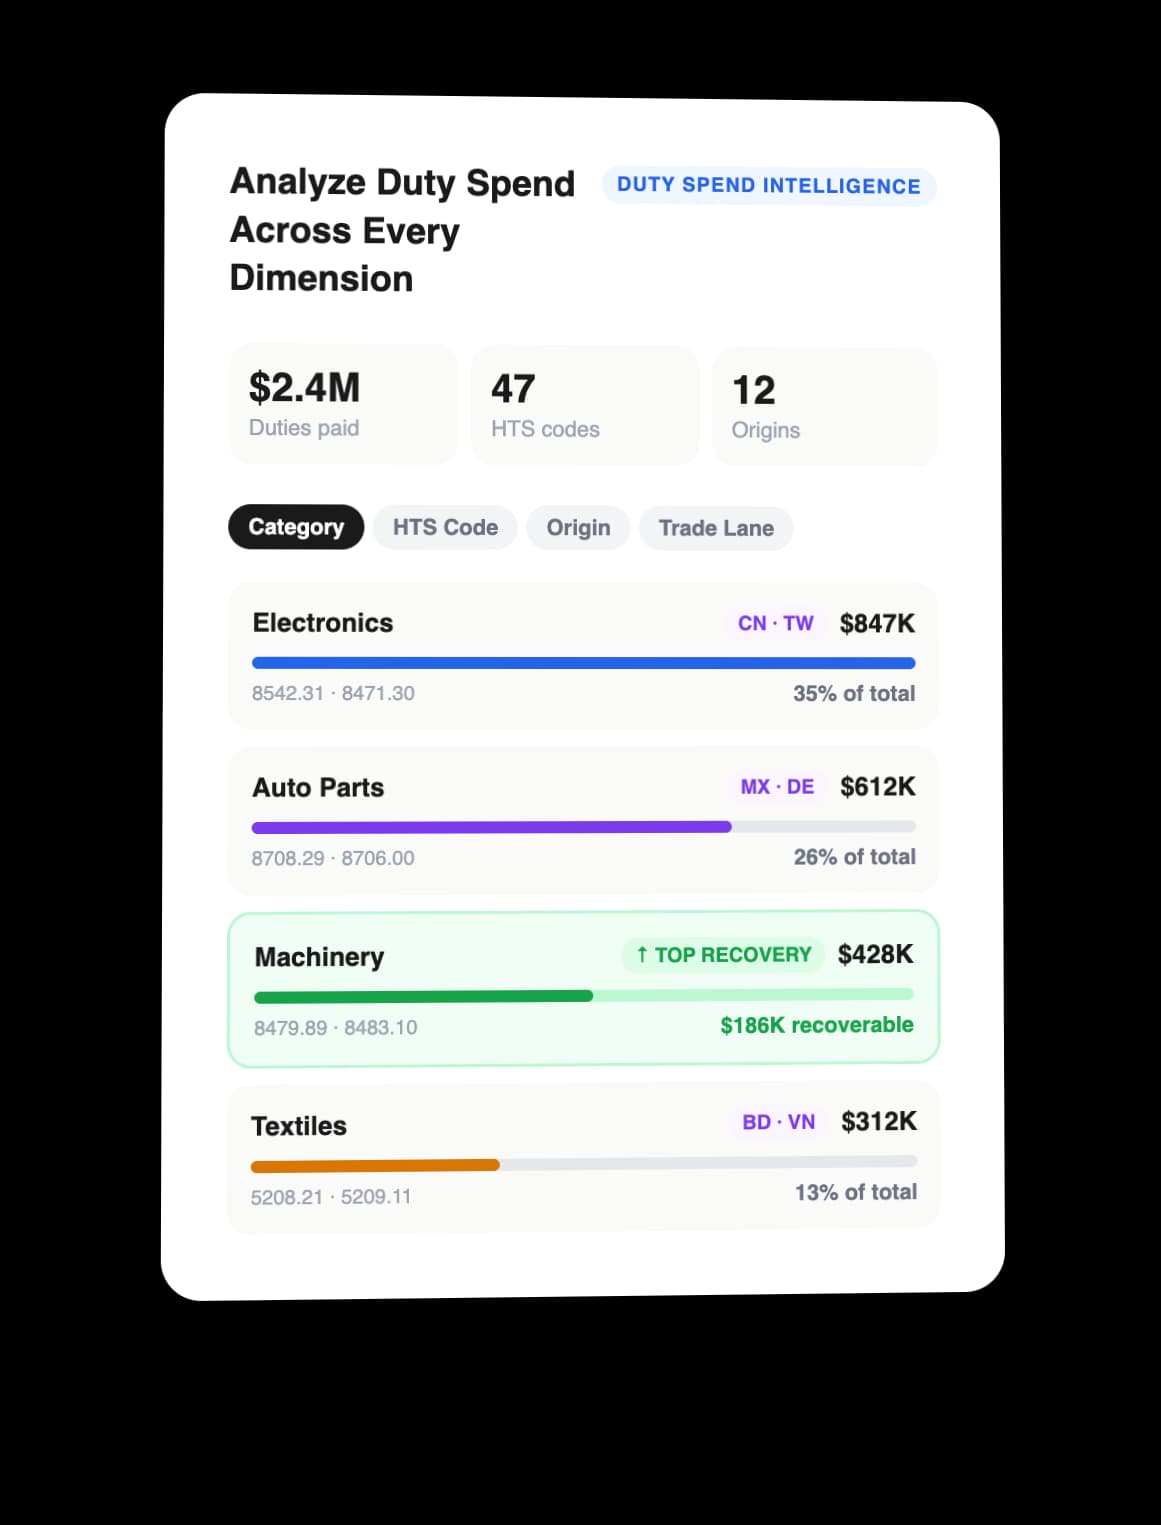
DUTY SPEND INTELLIGENCE
Analyze Duty Spend Across Every Dimension
Zollback breaks down your duty spend by product category, HTS code, country of origin, and trade lane — giving finance and supply chain teams a structured view of where import costs are concentrated and where recovery opportunities are largest.
- Segment by HTS code or origin
- Product and trade lane breakdowns
- Identify highest-recovery product lines
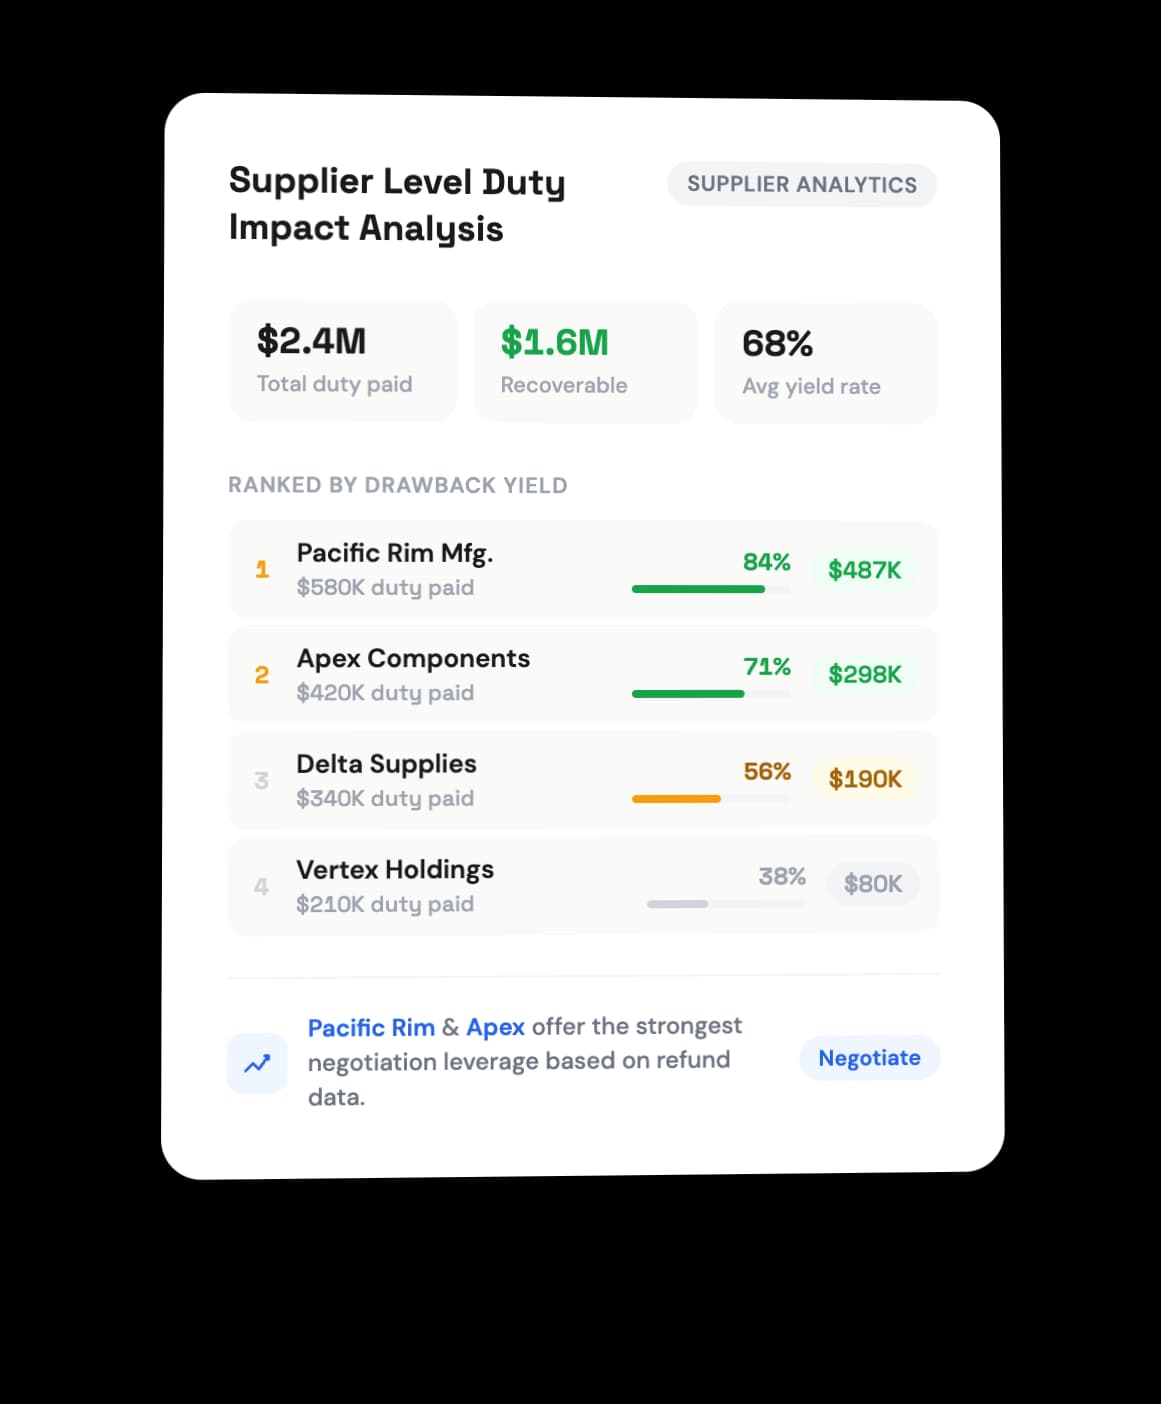
SUPPLIER ANALYTICS
Supplier Level Duty Impact Analysis
Understand which suppliers' imports generate the most drawback-eligible transactions. Zollback maps duty spend and recovery potential to individual supplier relationships, so sourcing decisions are informed by real refund data rather than estimates.
- Rank suppliers by drawback yield
- Link sourcing decisions to refund data
- Supports strategic supplier negotiations
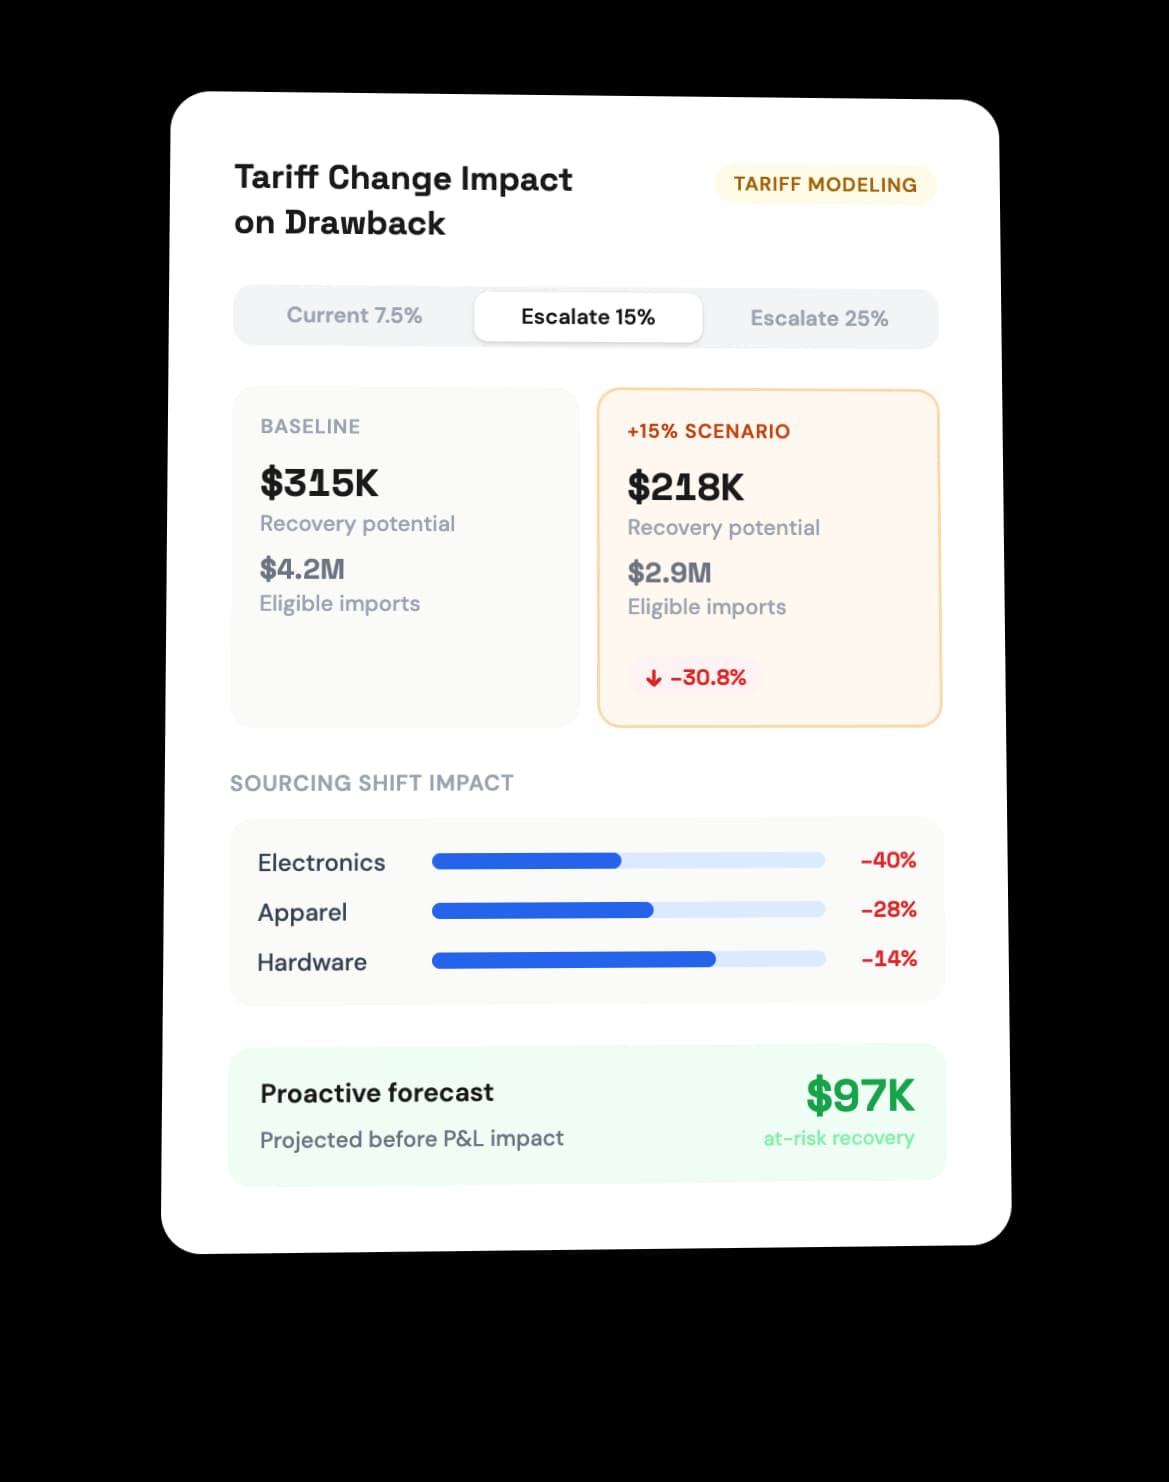
TARIFF MODELING
Model Tariff Change Impact on Drawback
When Section 301 rates shift or new tariffs are introduced, Zollback models how those changes affect your drawback eligibility and recovery potential — before they hit your P&L. Especially relevant for companies navigating ongoing trade policy uncertainty.
- Section 301 escalation scenarios
- Sourcing shift impact modeling
- Proactive eligibility forecasting
RECOVERY BENCHMARKING
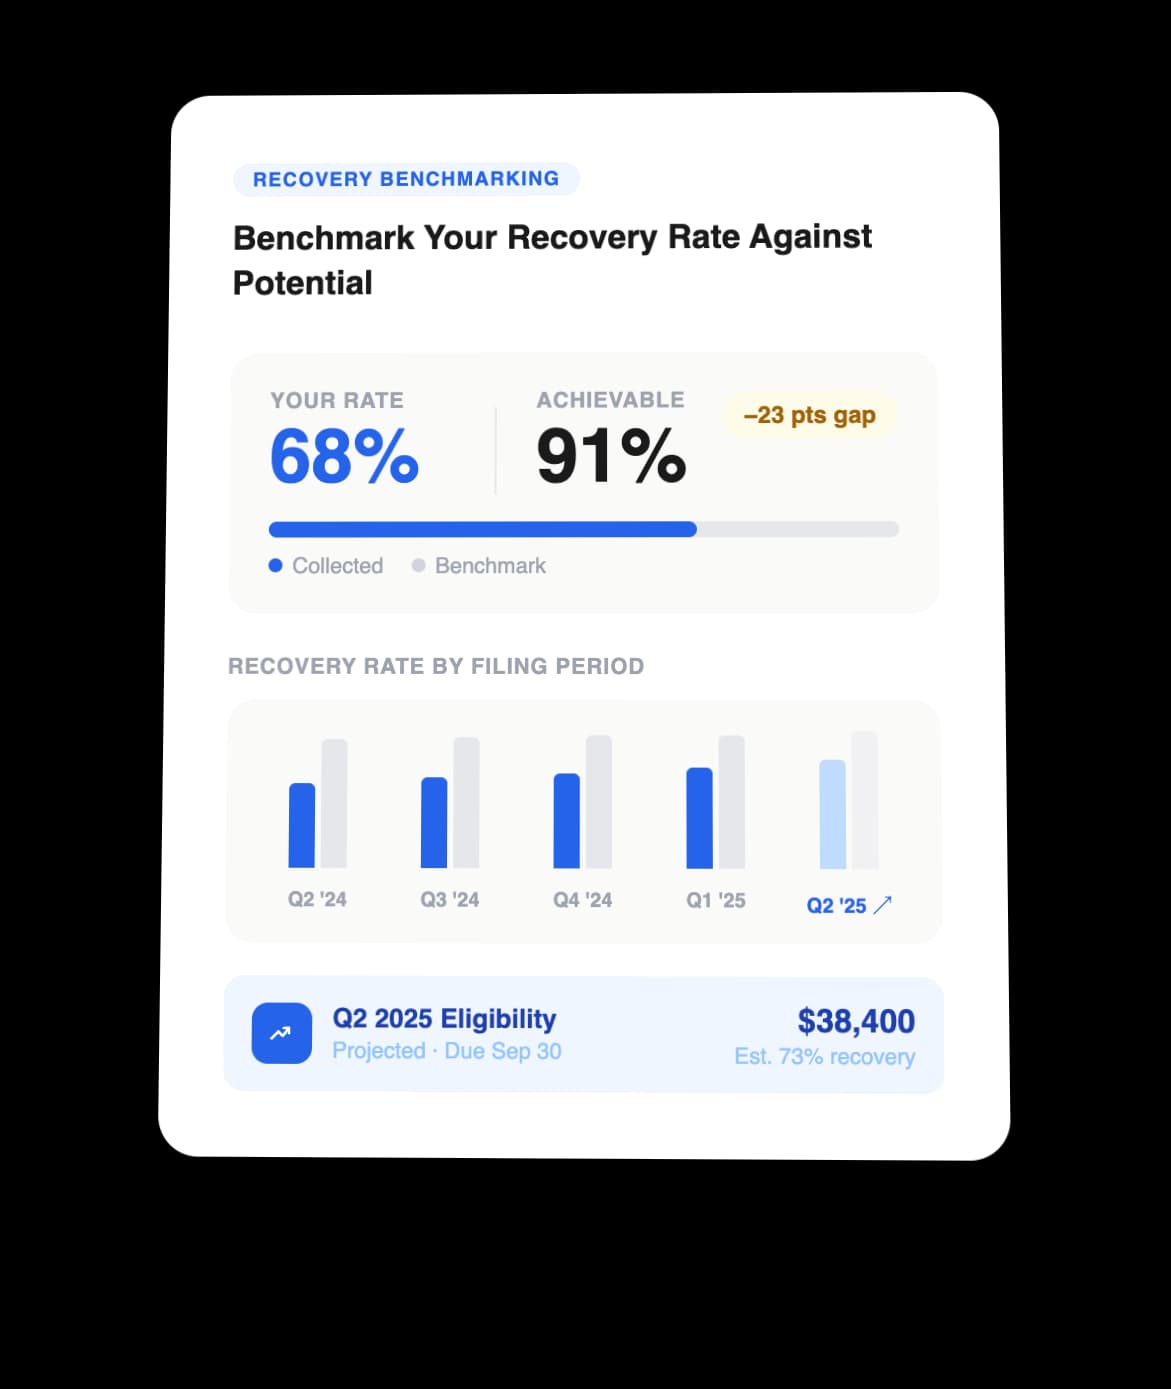
Benchmark Your Recovery Rate Against Potential
Zollback compares your actual drawback recovery rate to what is achievable given your trade profile — surfacing the gap between what you are collecting and what you are leaving on the table. Track refund recovery rates over time across filing periods.
- Recovery rate vs. achievable benchmark
- Historical trend analysis by period
- Predictive view of upcoming eligibility
EXECUTIVE REPORTING
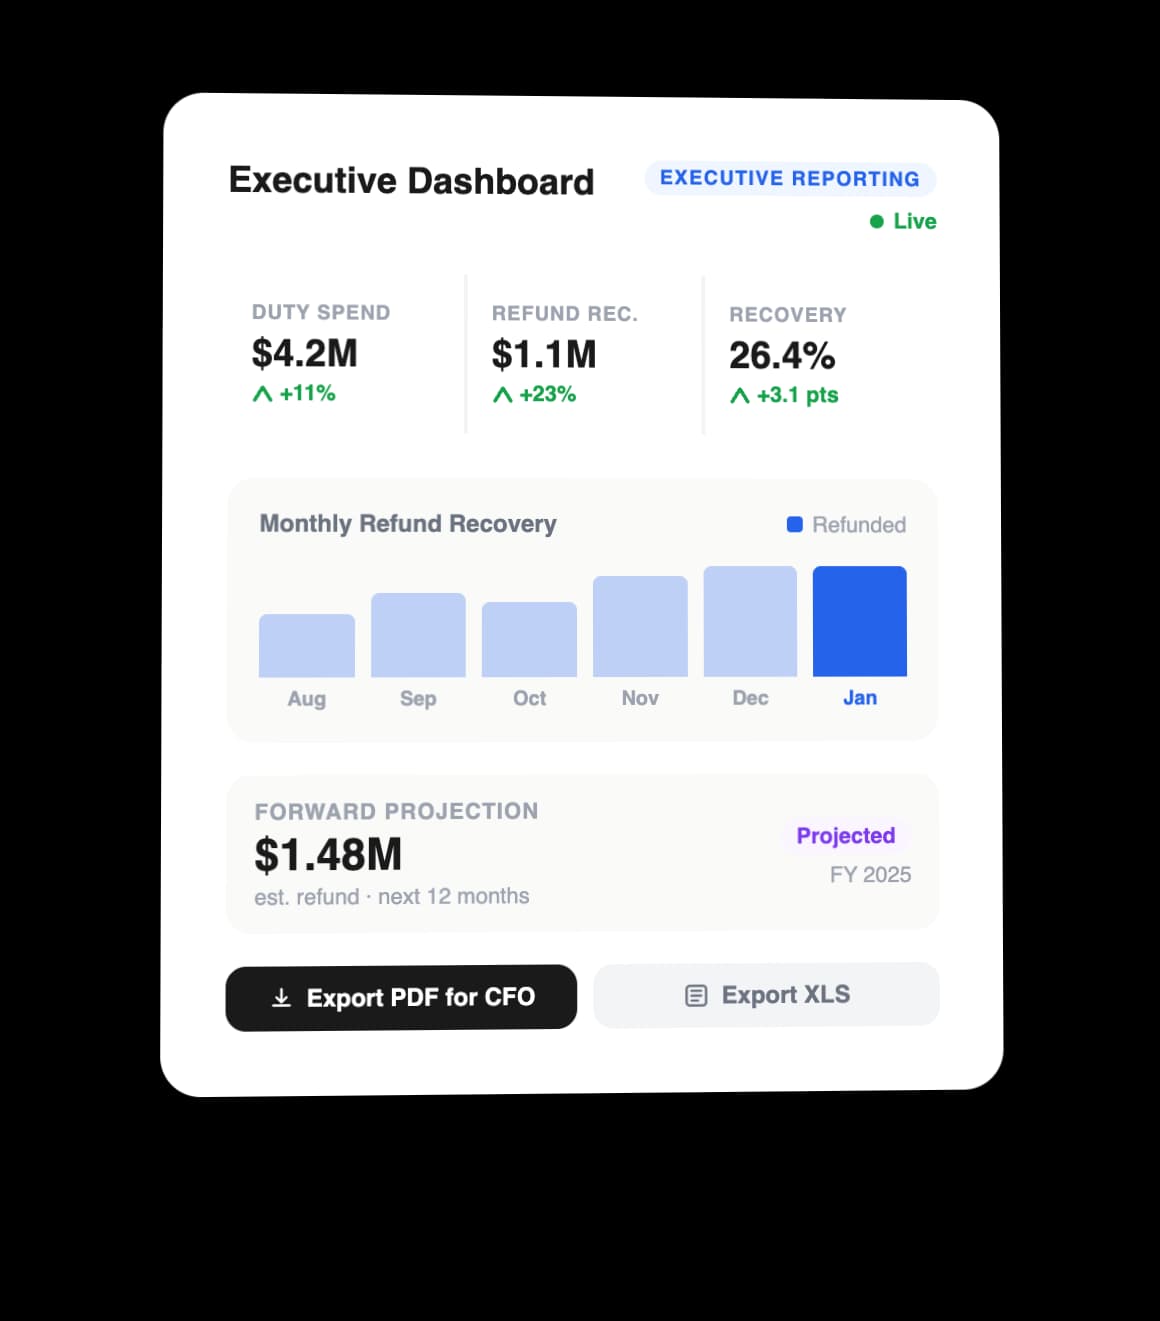
Dashboards and Reports for Leadership
Zollback generates exportable executive dashboards built for board and CFO presentations — translating complex drawback data into clear financial narratives. Reports cover duty spend, refund recovery rates, filing history, and forward-looking projections.
- Exportable reports for CFO presentations
- Real-time executive dashboard
- Clear financial narrative from trade data
See What Your Trade Data Reveals
Get a free drawback assessment and see the duty spend analytics your current provider is not showing you. No upfront fees — ever.
Get Your Free Assessment